Is Component Testing Using the ROSE Test Practical?
By Joe Russeau, Precision Analytical Laboratory and Mark Northrup, IEC Electronics
In a previous article titled, It’s Time to Retire ROSE Testing, Mark and I discussed the basis for why ROSE testing should be retired as an industry “cleanliness or process control” test. In this article we reemphasize our position by highlighting some work we presented at the 2017 SMTA International Conference comparing component cleanliness results from the Resistivity of Solvent Extract (ROSE) against Ion Chromatography (IC) results. For those of you interested in reviewing that body of work, the working title was PCBA Component Cleanliness Specifications Limits are Lacking.
The ROSE test has been used in the electronics industry since the early 1970’s. It was originally developed to estimate the amount of residual rosin flux remaining on a printed board from that time period. The predominant flux from that era contained greater than 30% rosin. So it should go without saying that modern day flux technology and circuit designs are vastly different from those 1970 predecessors. By that same token, our methods for assessing the ionic “cleanliness” of printed board assemblies are vastly different as well, right? Well, not exactly. The ROSE test is still the most predominantly used ionic “cleanliness” test in our industry and in truth it has not been modified or changed since the early 1980’s. In addition, ROSE testing is not only used for determining the ionic “cleanliness” of printed boards (PB’s) and printed board assemblies (PBA’s), but it is also being used for evaluating the cleanliness of components (See GEIA-STD-0006).
In the previous article Mark and I indicated that there were two important attributes necessary for evaluating the ionic cleanliness of PB’s and PBA’s. These attributes would be considerably more crucial for evaluating components. We said that those two attributes were selectivity and sensitivity. In order to properly evaluate ionic cleanliness it is important to use as little extraction solvent as possible (to concentrate the residues to the area being evaluated) and to have a system that can identify each specific residue that is present. The ROSE test provides a single bulk value (not ion selective) and liters of solution are often used, which affects the sensitivity.
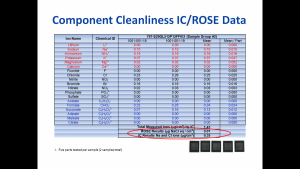
Please consider the results in the following table taken from our 2017 SMTAi presentation.

Before I discuss the results in the above table, it would be prudent to first discuss what was done. First, the cleanliness of five different ball grid array (BGA) groups (i.e. size, ball count and pitch) was baselined using IC. We processed two replicates for each group because we had a limited number of parts to work with. The BGA’s were then sent to be re-balled using a standard robotic reballing process. The ionic cleanliness of each group was then re-evaluated using the ROSE test as defined in the GEIA-STD-0006 and again with IC. The solvent volumes used for each test were five milliliters for the IC test and ninety-eight milliliters for the ROSE test.
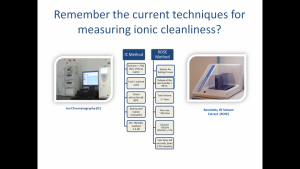
Here is a side-by-side overview of what was done for this testing:

The different ions listed in the table are from the IC test. As we have indicated, IC has considerably greater selectivity than does ROSE and can identify specific ion species from a sample extract. At the bottom of the table you will see a red circle around the ROSE and IC results. The ROSE result is expressed as μg of NaCl equivalents per square centimeter. It is important to understand that this is neither a measurement of sodium nor chloride, but an expression of the result compared to a standardized solution of a NaCl salt, which is used to standardize the instrument. The IC results are given as micrograms of ion per square centimeter. The IC results are direct measurements made back to certified standards of specific ion species. Each ion species is calibrated separately.
In our example, we compared the ROSE result with the sodium and chloride ion results from the IC test. The sodium and chloride ion results from the IC test were added together to be able to make the comparison to the ROSE results. Please be aware that this is not an exact comparison of the results from the two tests because of how their units are defined (μg of NaCl equivalents / cm2 vs. μg/cm2).
Comparing the ROSE results to the IC results, we found that the IC test gave a substantially higher response on four of the five tested BGA groups when comparing just two ions. If you consider all of the ions that were measured by the IC compared to the ROSE results, then there was no comparison. The IC test provided far more insight into the ionic cleanliness of all five BGA groups. Please be aware that we are not making a claim in this study about “how clean is clean enough”, but to show that the ROSE test is an inadequate tool for low level evaluations of ionic residues as are needed for modern electronic products.
If you want to participate in advancing cleanliness measurement technology, or you have any questions, or suggestions, please feel free to contact either Mark or myself.

Joe Russeau, Precision Analytical Laboratory, jrusseau@precisionanalyts.com

Mark Northrup, IEC Electronics, mnorthru@iec-electronics.com
ROSE System

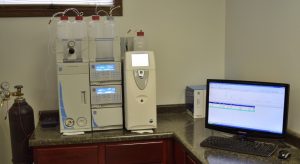
IC System

Ion Chromatogram


