Is the China Gold Rush Over?
Bishop & Associates has been tracking the connector industry since 1980 by product type, by end-use marker sector and by major geographic region. When we initially starting reporting on the industry, China’s connector sales were so insignificant we included China’s numbers as part of the Asia Pacific region.
SOURCE: TTI MarketEye
We began reporting China as a separate region in 1994 because we began to see the potential of this huge untapped market. In 1994 China’s connector sales were only $38 million, or just 0.19 percent of a $20.2 billion global connector market!
Of course, from there, European and North American based companies started investing billions to move manufacturing to China. The objectives were twofold: to capitalize on cheap labor, allowing manufacturers to lower prices to consumers in the West and to capture more of the growing consumer market in China.
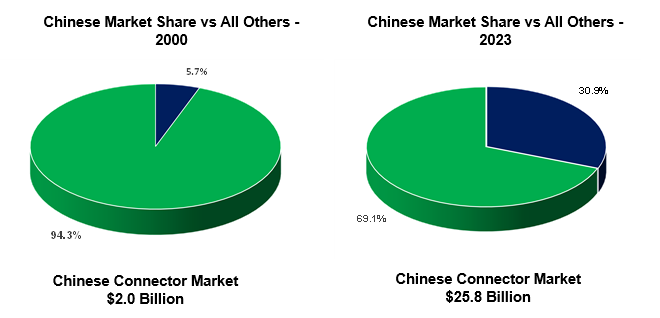
From a meager $38 million in connector sales, by year 2000 China was accounting for $2.0 billion annually or 5.7 percent of the total connector market and still growing!
Since 2000, China has been the growth engine for the connector industry and the overall electronics industry. As noted, China accounted only for 5.7 percent of the global connector market in 2000. By 2023 China accounted for 30.9 percent of the global connector market.
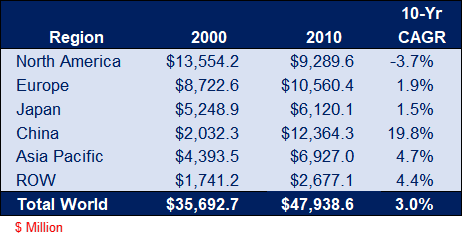
China out-performed all other regions since the beginning of the 21st century. This is clearly shown in the table below.

During the 2000-to-2010 period, China achieved growth of 19.8 percent versus industry growth of only 3.0 percent. This is in sharp contrast to the other regions who were negative or exhibiting low single-digit growth. Clearly China was the source of sales growth for the connector industry.
Connector Sales by Region 2000 vs 2010
with 10-Year CAGR
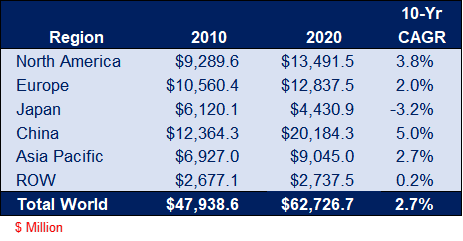
During the next decade, 2010 to 2020, China still outperformed the other regions in sales growth but the slowdown was dramatic. China went from a 19.8 percent CAGR to 5.0 percent.
Connector Sales by Region 2010 vs 2020
with 10-Year CAGR
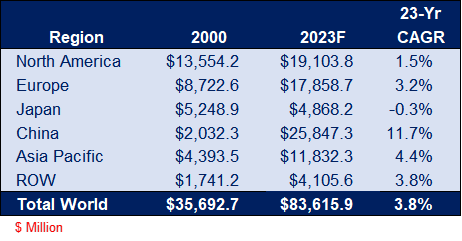
When analyzing connector sales by region over the past 23 years (2000 through 2023), it is obvious that China has been the growth engine in the 21st century. China’s CAGR is 11.7 percent compared to the industry CAGR of 3.8 percent.
Connector Sales by Region 2000 vs 2023
with 23-Year CAGR
Analysis of connector sales by region over various timelines results in several conclusions:
- The transfer of manufacturing from West to East occurred mainly in the first decade of the 21st century. China achieved connector growth of 19.8 percent while the total industry only achieved 3.0 percent growth.
- The flow of Western capital to China slowed significantly during the second decade of the century. China’s growth more closely resembled overall industry growth.
- The transfer of wealth from West to East has slowed appreciably in recent years. This causes us to conclude that the gold rush from West to East is over, or at a minimum, has slowed dramatically.
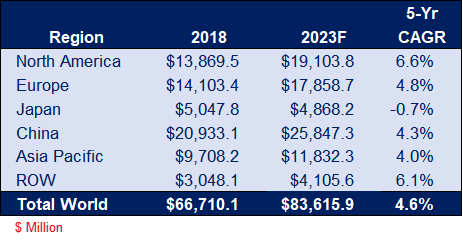
Further evidence that China’s largest growth years are behind is shown in the analysis below. During the last five-year period (2018 to 2023), China and even the Asia Pacific area have performed below North America, Europe and the ROW region. When you include Japan, the West significantly outperformed the East!
Connector Sales by Region 2018 vs 2023F
with Five-Year CAGR
Final thoughts:
- It is our opinion that Western leadership will be very cautious in deploying new capital to China. It fact, we believe the West will re-shore some manufacturing,
- New capital into China will be mostly to support existing manufacturing.
- China’s economy is probably facing some lean years. Already we are noticing a gradual drop in GDP. Some are projecting a 2 percent GDP for China by 2030.
- China’s aggressive posture regarding Taiwan has the entire Asia Pacific region very concerned. This will further reduce Western capital into China.
Bishop & Associates, incorporated in 1985, is the leading research firm on the connector industry. The Bishop Report is a monthly newsletter that tracks the performance of the industry. To learn more, or to subscribe, follow this link.


