Help Wanted: Evaluating Labor Shortages in Manufacturing
By Maria D. Tito1, Economist, Federal Reserve Board of Governors
According to the latest data from the Labor Department’s Job Openings and Labor Turnover Survey (JOLTS), the number of job openings in manufacturing decreased in December, while the number of hires moved up. With a gap between job openings and hires–traditionally viewed as a measure of skill mismatch–that is shrinking, the JOLTS report does not seem fully consistent with anecdotal evidence on tightening labor supply constraints in manufacturing.2
In this note, we examine the extent of labor shortages for the manufacturing sector. Extending recent work by Morin and Stahl (2013), we rely on data from the Quarterly Survey of Plant Capacity (QSPC), a survey–principally funded by the Federal Reserve Board (FRB)–that collects data on actual production and respondents’ estimates of full capacity. Survey participants are also asked to detail the reasons for not operating at full capacity, with “insufficient supply of local labor force/skill” appearing among the possible answers.3 While respondents can select multiple answers, we interpret the share of respondents reporting “insufficient supply of local labor force/skill” as a measure of binding labor supply constraints in manufacturing.
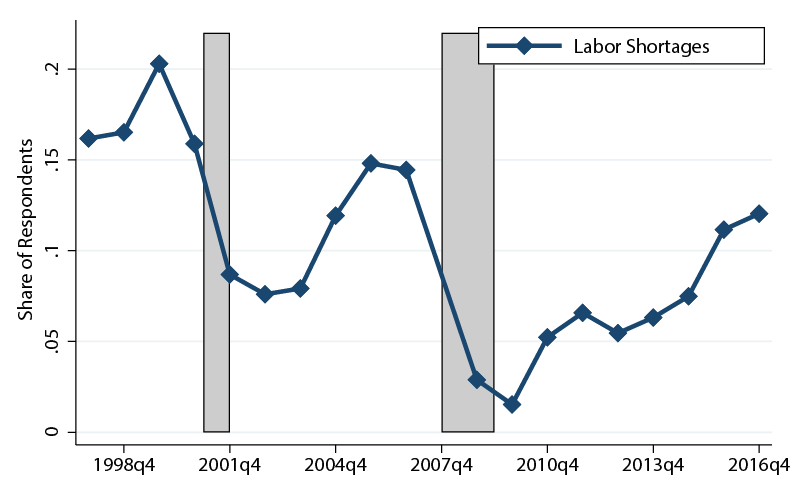
Source: U.S. Census Bureau, Manufacturing and Construction Division.
Note: Share of respondents reporting insufficient labor/skill as a factor restraining production; shaded areas represent NBER recessions.
Figure 1 displays the evolution of the share of respondents reporting labor shortages as a factor restraining production; the data are shown for the fourth quarter of each year.4 Reports of labor shortages tend to decline during recessions and to recover during expansions. In the fourth quarter of 2016, the share of respondents indicating insufficient labor/skill reached 12 percent, up considerably from the lows of the Great Recession, but still below pre-recession peaks. With the most recent data release, labor shortages in manufacturing jumped to 17.4 percent in the third quarter of 2017–about 7 percentage points above the 2016q3 reports–a level that appears on the high-end of historical values but likely compatible with a continued expansion.
The evidence captured by our survey-based measure is consistent with traditional measures of labor market tightness. In particular, models of labor market search point to the vacancy-to-unemployment ratio, v/u, as a measure of market tightness, where v denotes the number of job openings and u is the number of unemployed.5 According this measure, the labor market is tighter the greater the number of employers seeking to fill job positions relative to the number of prospective workers looking for jobs.
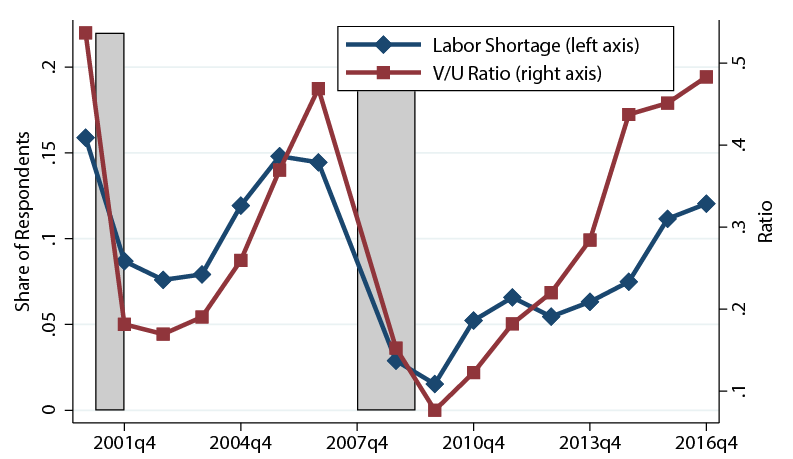
Note: Share of respondents reporting insufficient labor/skill as a factor restraining production; shaded areas represent NBER recessions.
Source: U.S. Bureau of Labor Statistics and U.S. Census Bureau, Manufacturing and Construction Division
Figure 2 compares our measure with data on v/u. With a correlation above 0.8, the two series tend to co-move considerably. The vacancy-to-unemployment ratio increased sharply in recent years and reached around 0.48 vacancy-per-unemployed in 2016q4, a little above the 2006 pre-recession peak.
Table 1: Labor Shortages by Industry
| Industry | 2006q4 | 2016q4 |
|---|---|---|
| Food | 6.1 | 13.3 |
| Beverage and Tobacco | 6.1 | 0.0 |
| Textile Mills | 10.2 | 4.5 |
| Textile Products | 4.8 | 13.4 |
| Apparel | 10.0 | 25.0 |
| Footwear | 8.6 | 1.3 |
| Wood | 16.1 | 25.8 |
| Paper | 3.2 | 15.3 |
| Printing | 8.1 | 7.0 |
| Petroleum and Coal Mfg | 12.2 | 0.0 |
| Chemicals | 4.7 | 6.2 |
| Plastics and Rubber Products | 11.2 | 12.3 |
| Nonmetallic Mineral Products | 6.9 | 12.9 |
| Primary Metal Mfg | 18.0 | 5.0 |
| Fabricated Metal Mfg | 2.7 | 11.9 |
| Machinery | 18.3 | 14.6 |
| Computer and Electronic Products | 5.8 | 12.1 |
| Electrical Equipment | 13.6 | 2.5 |
| Transportation | 21.2 | 16.1 |
| Furniture | 16.5 | 9.5 |
| Miscellaneous | 14.7 | 13.9 |
Source: U.S. Census Bureau. Manufacturing and Construction Division.
Note: Percentage of respondents reporting insufficient labor/skill by 3-digit NAICS sector.
To better understand aggregate trends, our analysis also looks behind the statistics for overall manufacturing. First, we explore differences across sectors. Table 3 details the shares of respondents reporting labor supply constraints by 3-digit NAICS industry code. Reports of shortages are highly heterogeneous across sectors, ranging from 2.7 percent in Fabricated Metal Manufacturing to 21.2 percent in Transportation Equipment in the fourth quarter of 2006. While the 2016q4 reports of shortages for the entire manufacturing sector remain roughly in line with the data from the fourth quarter of 2006, the dispersion in labor shortages across sectors is much higher in the 2016q4 distribution. Figure 3 inspects yearly patterns of two groups of industries, durable vs. nondurable sectors. Our analysis highlights that the level and the volatility of labor supply constraints tend to be higher in durables industries–with a higher volatility likely associated with the high cyclicality of durable goods consumption and employment.6 The share of respondents reporting labor shortages rose in both sectors after the Great Recession, but with significant differences: Relative to history, labor supply constraints in 2016q4 appear to matter more for nondurables.
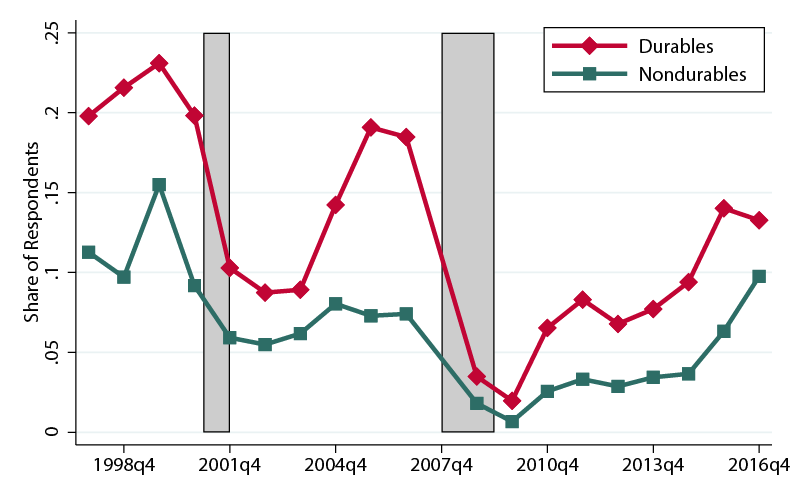
Source: U.S. Census Bureau. Manufacturing and Construction Division.
Note: Share of respondents reporting insufficient labor/skill as a factor restraining production; shaded areas represent NBER recessions.
As a second comparison, we looked at differences across firms by size class. Anecdotal evidence suggests that small firms may have a harder time in finding qualified workers. According to the National Federation of Independent Business’ (NFIB) survey, 19 percent of small business owners–a level that is about 2 percentage points above the shortage number from the 2017q3 QSPC report–cited the difficulty of finding qualified workers as their Single Most Important Business Problem during the third quarter of 2017, second on the list of important problems behind taxes. However, with differences in structure and coverage between the NFIB and the QSPC surveys, we cannot draw direct inferences on systematic patterns across size classes. Instead, we exploit additional firm-level information in the QSPC data to identify differences between small and large firms. Figure 4 highlights differences in labor supply constraints between the firms in the top 10thpercentile and those in the bottom 10th percentile of the firm size distribution. We consider two measures of firm size, the number of production workers and the value of production. To define a constant ranking of firms over time, we construct the average number of production workers and the average value of production between 1997 and 2016; figure 4a relies on the ranking from the average number of production workers, whereas figure 4b uses the ranking from the average revenue distribution. Different patterns are associated to the two size proxies. While there is not a significant difference across firms if looking at the top and bottom of the distribution of production workers, discrepancies are more evident over the revenue distribution: On average, less than 1 percent of firms in the top 10 report labor shortages vs. 2 percent of the smallest firms. The divergence in shortage reports over the revenue distribution, however, tends to shrink during recessions and increase during expansions, reaching 2.5 percentage points in 2016q4.
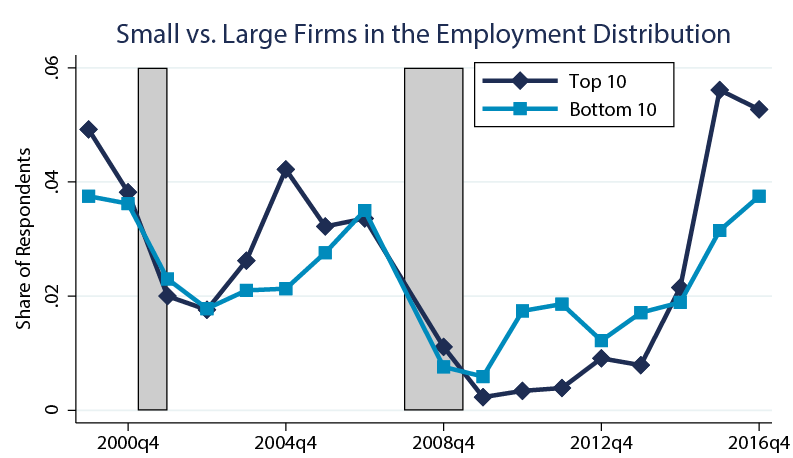
Source: U.S. Census Bureau. Manufacturing and Construction Division.
Note: Share of respondents reporting insufficient labor/skill as a factor restraining production; percentiles are obtained from the distribution of production workers. Shaded areas represent NBER recessions.
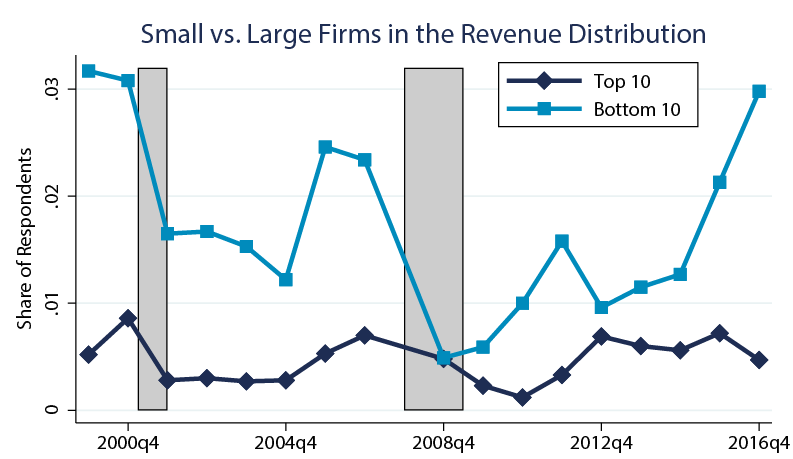
Source: U.S. Census Bureau. Manufacturing and Construction Division.
Note: Share of respondents reporting insufficient labor/skill as a factor restraining production; percentiles are obtained from the revenue distribution. Shaded areas represent NBER recessions.
Do labor shortages ultimately have an impact on the firm ability to vary production or employment levels in response to demand shocks? We investigate this question by looking at outcomes of firms reporting labor shortages across sectors with different exposure to demand shocks. Our baseline equation relates firm outcomes to reports of labor shortages and demand shocks,
Table 2. Effects of Labor Shortages
| (1) | (2) | (3) | (4) | (5) | (6) | |
|---|---|---|---|---|---|---|
| Variables | ln Rt+1 | ln Emplt+1 | ||||
| Lab. Short | -0.351*** | 0.197 | 0.383 | -0.049* | 0.459** | 0.492* |
| (0.03) | (0.25) | (0.32) | (0.03) | (0.22) | (0.27) | |
| Lab. Short * US Imports | -0.039** | -0.037** | ||||
| (0.02) | (0.02) | |||||
| Lab. Short * non-US Imports | -0.047** | -0.035** | ||||
| (0.02) | (0.02) | |||||
| Sectora-Year | y | y | y | y | y | y |
| Obs. | 60,000 | 60,000 | 60,000 | 54,500 | 54,500 | 54,500 |
| R2 | 0.247 | 0.269 | 0.271 | 0.176 | 0.2 | 0.2 |
Notes: Firm-level yearly regressions, 1997q4-2016q4. Standard errors are clustered at the firm level.
a 3-digit NAICS dummies.
In Rt+1: firm revenues at t + 1 in log-s.
In Emplt+1: total production workers at t + 1 in log-s.
Lab. Short: dummy equal to one for firms reporting “insufficient labor/skill” among the factors restraining production.
US Imports: U.S. imports for sector s (6-digit NAICS) at time t in log-s.
Non-US Imports: World imports for sector s (6-digit NAICS) at time t, excluding U.S. imports, in log-s.
Legend : *** significant at 1%, ** at 5%, * at 10%.
Source: U.S. Census Bureau, Manufacturing and Construction Division and UN COMTRADE.
We also tried a variant of equation (1) that adds firm fixed effect to test whether the effect on firm revenues and output is driven by differences across firms. Including firm fixed effects in our specification drives the significance of our main coefficient to zero, implying that the main source of variation in firm outcomes does come from cross-sectional differences and not within-firm changes in reports of labor shortages. This result suggest firms that start facing labor shortages over the sample do not experience a significant negative effect on future production or hiring. That is, while firms reporting labor shortages seem to significantly curtail future production and employment in sectors experiencing positive demand shocks, we cannot exclude that firm-specific time-invariant characteristics are responsible for our findings.
The QSPC-based measure of labor shortages contributes to furthering our understanding of labor market conditions in manufacturing. While remaining below the late 1990s peak, our indicator suggests that resource utilization constraints in manufacturing are continuing to build up, and it may be useful to continue monitoring its behavior in the quarters ahead.
References
Bils, Mark and Peter J. Klenow (1998). “Using Consumer Theory to Test Competing Business Cycle Models,” Journal of Political Economy, 106(2).
Caramp, Nicolas, David Colino, and Pascual Restrepo (2017). “Durable Crises”, Working Paper.
Dunkelberg William C. and Holly Wade. “Small Business Economic Trends,” July-September 2017, NFIB, accessed on February 1, 2018 at http://www.nfib.com/assets/SBET-July-2017.pdf, https://www.nfib.com/assets/SBET-August-2017.pdf, https://www.nfib.com/assets/SBET-Sep-2017.pdf.
The Skills Gap in U.S. Manufacturing and Beyond. Deloitte and Manufacturing Institute. 2015, accessed on February 1, 2018 at http://www.themanufacturinginstitute.org/~/media/827DBC76533942679A15EF7067A704CD.ashx
Shimer, Robert. “The Cyclical Behavior of Equilibrium Unemployment and Vacancies,” American Economic Review, March 2005, Vol. 95, Issue 1, pp. 25-49.
Stahl, Jessica C., and Norman Morin (2013). “Looking for Shortages of Skilled Labor in the Manufacturing Sector,” FEDS Notes 2013-09-26. Board of Governors of the Federal Reserve System (U.S.).
U.S. Bureau of Labor Statistics. Job Openings and Labor Turnover Survey (Public Data), http://www.bls.gov/jlt/.
U.S. Census Bureau. Manufacturing and Construction Division. Survey of Plant Capacity Utilization, http://www.census.gov/manufacturing/capacity/.
Weber, Lauren and Rachel Feintzeig (2018, February 15), “To Fill Jobs in a Tight Labor Market, Employers May Need to Get Creative,” The Wall Street Journal, accessed on February 16, 2018 at https://www.wsj.com/articles/to-fill-jobs-in-a-tight-labor-market-employers-may-need-to-get-creative-1518616800
1. We would like to thank Norm Morin for helpful comments and Emily Wisniewski for excellent research assistance. Any opinions and conclusions expressed herein are those of the author and do not necessarily represent the views of the U.S. Census Bureau, the Board of Governors, or its research staff. All results have been reviewed to ensure that no confidential information is disclosed. Return to text
2. Several articles emphasize labor shortages for manufacturing. See, for example, Weber and Feintzeig (2018) and the 2015 report by Deloitte and the Manufacturing Institute. Return to text
3. See item 3, Part B, in the survey form. Return to text
4. Data are available on a quarterly basis after 2008. Before 2007, data were collected only for the fourth quarter of each year. Questions on the factors restraining production were not included in the 2007 survey. Return to text
5. See, for example, Shimer (2005). Return to text
6. See Bils and Klenow (1998) and Caramp, Colino, and Restrepo (2017). Return to text
7. Domestic absorption, the total demand of all goods and services by all economic agents in a given economy, includes import spending. While data on imports at the industry level are readily available, industry-specific domestic demand is more difficult to measure. Return to text
8. Non-U.S. imports are constructed as the difference between world and U.S. imports. Return to text


